
Manufacturing Supply Chain Optimization Scenario hero image
Educational sourcing scenario

Manufacturing Supply Chain Optimization Scenario

A manufacturer reviewing supplier dependency, lead times, component availability, and backup options.

📍

On the ground across China

Supplier calls, factory questions, and follow-up handled during China business hours.

⚖️

Quotes made comparable

Price, MOQ, materials, lead time, and terms aligned side-by-side before you decide.

Verified before deposit

Supplier and factory checks coordinated before your money moves — not after.

🤝

Buyer-approved, LIFA-managed

LIFA runs the daily sourcing work; you approve supplier choice, quotation, and payment.

Educational scenario: This page is a practical sourcing scenario for planning and risk review. It is not a promise of results, a client claim, or a claim of supplier performance.

Transparency note: This is an educational sourcing scenario, not a published client result or testimonial. It shows how LIFA thinks through a common buyer situation without inventing private client data.

The Situation

A mid-sized industrial equipment manufacturer had grown to $85M in annual revenue but was constrained by supply chain fragmentation. The company sourced component assemblies from 200+ different suppliers spread across multiple tiers: 40 Tier 1 (final assembly partners), 80 Tier 2 (component manufacturers), and 80+ Tier 3 (material/specialty suppliers). This sprawling network had evolved organically over 15 years as the company added product lines and grew into new markets. No one at the company had a complete map of the supplier ecosystem. Quality issues in one line affected others unpredictably. Lead time visibility was poor—when production delays happened, it took weeks to trace the root cause. Component cost variation was extreme—different product lines paid different prices from the same suppliers for identical parts. The manufacturing operation was running at 78% efficiency due to supply chain unpredictability and constant firefighting to overcome bottlenecks.

The founder knew consolidation was needed but lacked a systematic framework for identifying which suppliers to keep, how to execute migrations without disrupting production, and how to ensure the remaining "best in class" suppliers could actually handle the volume concentration.

The Challenge

The core challenge was managing a complex consolidation of 200 suppliers into a lean, optimized network:

  • Supplier Mapping and Performance Visibility: No comprehensive map existed of all suppliers, their product contribution, cost, quality, and delivery performance. Some legacy suppliers from acquired business units were still active but redundant. Some "backup" suppliers had never actually been used.
  • Cost Variation Across Product Lines: The same sub-assembly (e.g., a power control module) was sourced from 3-4 different suppliers at different prices ($850-$1,150 per unit) depending on which product line ordered it. No standardization meant millions in excess cost.
  • Quality and Delivery Unpredictability: Defect rates varied wildly: some suppliers delivered 99.2% quality, others 94-95%. Delivery performance ranged from 92% on-time (to commitments) to 67% on-time. This variation created constant schedule pressure.
  • Negotiation Leverage Fragmentation: With 200 suppliers, the company had no significant leverage with any individual supplier. A supplier getting $500K in annual volume might represent only 2-3% of that supplier's business. Large competitors with $1-2M annual volumes had far better negotiating position.
  • Onboarding and Process Management: Each supplier had different quality processes, documentation standards, communication protocols, and delivery procedures. Managing 200 different processes was unsustainable as the company scaled.
  • Risk of Single-Supplier Dependency: After consolidation, some suppliers would represent 8-10% of total supply chain cost. Loss of a single supplier could shut down production. Building resilience while consolidating required careful planning.
  • Production Continuity During Transition: Migrating from 200 suppliers to ~85 suppliers while maintaining production was logistically complex. Moving volume from one supplier to another could create shortage in the transition period if not carefully orchestrated.

Planning assumptions in this scenario: 200+ active suppliers, 78% manufacturing efficiency, estimated $2M+ in cost savings opportunity through consolidation, 18+ month projected timeline for supply chain optimization (unacceptable), 15-20% quality variation across suppliers, 25% on-time delivery performance variation.

How LIFA Would Support This Scenario

Phase 1: Supply Chain Audit and Supplier Segmentation (Weeks 1-6)

LIFA would conduct a comprehensive supply chain audit: mapped all 200+ suppliers, collected annual spend data by supplier, gathered quality metrics (defect rate, rejection rate), delivery performance data (on-time % vs. commitment), and supplier financial stability indicators. This created a complete supply chain visibility dashboard for the first time in company history.

With complete data, LIFA segmented suppliers into tiers: (A) Strategic partners (top 15 suppliers representing 60% of spend and 99%+ quality performance), (B) Core partners (next 35 suppliers representing 30% of spend and 97%+ quality), (C) Commodity suppliers (40 suppliers representing 8% of spend), and (D) Legacy/redundant suppliers (110+ suppliers representing 2% of spend with low quality or duplicate coverage).

LIFA would recommend consolidating from 200 to 85 suppliers: retaining all 15 Strategic partners (Tier A), retaining 60 of the 35 Core partners, consolidating Tier B by selecting the best-in-class performer for each component type, eliminating all 110 Legacy/redundant suppliers, and absorbing their volume into Strategic/Core partners. Estimated cost impact: $17.5M annual savings (20.6% reduction in component costs).

Deliverables: Complete supplier map with spend/quality/delivery data, segmentation analysis, consolidation recommendation (200 → 85 suppliers), cost savings projection ($17.5M annually).

Phase 2: Strategic Partner Development and Negotiation (Weeks 7-14)

LIFA would work with the company's leadership to develop contracts with retained suppliers. For the 15 Strategic partners, the company offered to consolidate redundant suppliers feeding the same products into single suppliers (increasing volume 20-30% on average), provided the suppliers agreed to (1) 8-15% cost reductions commensurate with volume growth and efficiency, (2) quality performance targets (99%+ on-time delivery, <0.5% defect rate), (3) 90-day advanced notice for any pricing or capacity changes, and (4) participation in quarterly performance reviews and continuous improvement initiatives.

All 15 Strategic partners agreed to consolidation. Average COGS reduction: 12.3% ($2.1M annually). All signed 3-year contracts with volume escalation clauses (pricing stepped down further as volume reached 120%, 140% of baseline).

For the 60 selected Core partners retained, LIFA would negotiate similar terms but with less aggressive targets (5-10% cost reduction, 98%+ on-time delivery, <0.8% defect rate). 58 of 60 partners agreed; 2 partners refused cost reduction and were transitioned out. Average COGS reduction with retained Core partners: 7.8% ($2.5M annually).

Deliverables: Contracts signed with all 15 Strategic partners (12.3% cost reduction), 58 Core partners retained with 7.8% cost reduction, 2 Core partners transitioned, transition plan for eliminating 110 Legacy suppliers.

Phase 3: Volume Migration and Production Continuity Management (Weeks 15-24)

LIFA managed the logistics of moving volume from eliminated suppliers to retained partners. The strategy was sequential migration by product line (not simultaneous across all products) to avoid supply disruption. For each product line, LIFA would coordinate (1) 2-week dual-sourcing period (both old and new suppliers producing to ensure continuity), (2) quality verification of first production run from new supplier, (3) formal sign-off from manufacturing before old supplier was fully cut off, and (4) 60-day wind-down period with old supplier to handle any remaining inventory or transition items.

Three product lines were migrated weeks 15-17, four more weeks 18-20, and the remaining four weeks 21-24. Each migration took roughly 4-6 weeks from start to full transition. During dual-sourcing weeks, inventory built slightly (2-week buffer) but provided risk mitigation. Once new supplier quality is treated as verified in the planning model, inventory was drawn down as old supplier was phased out.

By week 24, all volume had been migrated to the new 85-supplier network. Total production hours lost to transition: 12 hours across the entire 10-week period (negligible, <0.05% of total manufacturing time). On-time delivery during transition period: 97.2% (slight improvement over pre-transition 94.8%).

Deliverables: Sequential migration of 11 product lines over 10 weeks, zero critical production disruptions, quality verification at each transition stage, full transition to 85-supplier network complete.

Phase 4: Process Standardization and Continuous Improvement (Weeks 25-36 and Ongoing)

LIFA would help the company implement standardized supplier management processes across all 85 retained suppliers: standardized quality documentation, standardized advance order windows (90 days for Strategic partners, 60 days for Core), standardized performance metrics (on-time delivery %, defect rate %, cost per unit indexed to baseline), and quarterly business review meetings with each supplier tier.

A supplier performance dashboard was created: real-time tracking of on-time delivery, defect rate, and cost per unit vs. contract targets. Monthly reports were generated showing performance trends and triggers for intervention if metrics degraded. Quarterly business reviews became regular forums to discuss performance, identify cost improvement opportunities, and develop joint improvement initiatives.

Deliverables: Standardized supplier management processes, real-time performance dashboard, monthly reporting, quarterly business review calendar and agendas established.

Illustrative Planning Outcomes to Review

MetricBefore ConsolidationAfter ConsolidationImprovement
Number of Active Suppliers200+8558% reduction in supplier count
Average COGS (Component Cost)$85.00/unit$67.50/unit$17.50/unit (20.6% reduction)
Annual Component Cost SavingsN/A$17.5M annually (at baseline $85M revenue)20.6% of component budget released
Quality - Defect Rate (Average)2.8% (range 0.4% to 5.2%)0.6% (range 0.4% to 0.8%)79% reduction in average defect rate; 62% quality improvement across system
On-Time Delivery Performance92.1% (range 67% to 98%)98.5% (range 98.0% to 99.2%)6.4 percentage points improvement
Lead Time VisibilityPoor (weeks to trace delays)Real-time visibility via dashboard100% visibility across supply chain
Manufacturing Efficiency78%91%13 percentage points (167% return on supply chain improvements)
Cost per Unit Variation (Std Dev)18% variation3.2% variation82% reduction in cost variation across product lines
Supplier Consolidation Risk (Single Supplier Dependency)Not measuredLargest 3 suppliers = 28% of spend; no single supplier >10%Balanced risk across multiple partners
Production Continuity During TransitionN/A97.2% on-time delivery during 10-week transitionZero critical production losses
Supplier Management OverheadComplex, manual, error-proneStandardized, automated dashboard, quarterly reviewsEstimated 400+ hours/year saved in supplier coordination

Illustrative planning impact: $17.5M annual cost savings (20.6%), 62% quality improvement (defect rate from 2.8% to 0.6%), 6.4 percentage point improvement in on-time delivery (92.1% to 98.5%), 13 percentage point improvement in manufacturing efficiency (78% to 91%). Manufacturing efficiency improvement alone—13 percentage points on an $85M revenue operation—represents $11M+ in incremental manufacturing capacity without adding equipment or headcount.

Timeline Breakdown

Phase 1

Supply Chain Audit

Weeks 1-6

Mapped 200+ suppliers, collected spend/quality/delivery data, segmented into tiers, developed consolidation recommendation (200 → 85).

Phase 2

Negotiation & Contracts

Weeks 7-14

Negotiated with 15 Strategic and 60 Core partners, locked 12.3% and 7.8% cost reductions respectively, signed 3-year contracts.

Phase 3

Volume Migration

Weeks 15-24

Executed sequential product line migration (11 lines over 10 weeks), maintained 97.2% on-time delivery, zero critical disruptions.

Phase 4

Process & Continuous Improvement

Weeks 25-36+

Implemented standardized supplier management, launched performance dashboard, established quarterly business review cycle.

Key Lessons

1. Supply Chain Fragmentation Creates Cost Inefficiency and Quality Unpredictability: With 200 suppliers, the company had no leverage and couldn't enforce consistent standards. Consolidating to 85 suppliers while actually improving quality (defect rate 2.8% → 0.6%) and delivery (92% → 98.5% on-time) proved that "more suppliers = more resilience" is a myth. Better suppliers are better insurance than redundant mediocre ones.

2. Cost Variation Across Product Lines is Hidden Value: The same component sourced at different prices depending on the product line represented $2M+ in recoverable cost. Standardizing procurement across product lines and consolidating volume unlocked negotiation leverage that wasn't available with fragmented sourcing.

3. Manufacturing Efficiency Improvement is Supply Chain Dependent: The 13 percentage point jump in manufacturing efficiency (78% → 91%) wasn't caused by equipment or process changes; it was caused by reliable supply chain performance. When suppliers deliver on time and quality is predictable, manufacturing can run at designed-for efficiency.

4. Strategic Consolidation Requires Phased Migration to Maintain Continuity: Attempting to consolidate 200 suppliers simultaneously would have caused production chaos. Sequential migration by product line (2-week dual-sourcing overlap, quality verification, then wind-down) enabled the transition with zero critical disruptions and actually improved on-time delivery during the transition period.

How LIFA Can Support

  • Supply Chain Audit and Mapping: Created complete visibility of all 200+ suppliers: annual spend, quality metrics (defect rate, rejection %, yield), delivery performance (on-time delivery %, lead time), and financial stability indicators.
  • Supplier Segmentation and Analysis: Categorized suppliers into Strategic (Tier A, 15 suppliers), Core (Tier B, 60 suppliers), Commodity (40 suppliers), and Legacy/redundant (110 suppliers). Recommended consolidation from 200 to 85 suppliers.
  • Cost Savings Projection: Analyzed cost variation across product lines, identified $17.5M in annual savings potential through consolidation and negotiation.
  • Strategic Partner Development: Negotiated contracts with 15 Strategic and 60 Core partners. Secured 12.3% and 7.8% cost reductions respectively, plus quality/delivery commitments (99%+/98%+ on-time, <0.5%/<0.8% defect rate).
  • Volume Migration Planning: Developed sequential migration plan by product line (11 product lines over 10 weeks), implemented 2-week dual-sourcing overlap for each transition, coordinated quality verification and wind-down of old suppliers.
  • Production Continuity Management: Managed transition with 97.2% on-time delivery maintained and zero critical production losses across 10-week migration period.
  • Standardized Supplier Management Processes: Designed standardized documentation, advance order windows (90/60 days), performance metrics (on-time %, defect rate, cost index), and quarterly business review cadence.
  • Performance Dashboard and Reporting: Implemented real-time supplier performance dashboard with monthly reporting and trend analysis. Established quarterly business reviews with each supplier tier.

What This Scenario Shows

From 200 suppliers to 85. From $17.5M in hidden cost savings to $17.5M extracted and banked. From 2.8% average defect rate to 0.6%. From 92.1% on-time delivery to 98.5%. From 78% manufacturing efficiency to 91%—an improvement that converted to $11M+ in additional manufacturing capacity without capital investment.

The consolidation was not a simple cost-cutting exercise. By consolidating to fewer, better suppliers and giving them significantly higher volume, the company actually improved quality and delivery performance while reducing cost. The Strategic partners got 20-30% volume increases, the company got 12.3% cost reductions and world-class quality/delivery. It was a mutually beneficial recalibration of the supply chain relationship dynamic.

The 13 percentage point manufacturing efficiency improvement (78% → 91%) is the most telling metric. This wasn't from new equipment or process innovation; it was from a supply chain that could be depended on. When suppliers deliver consistently on-time with predictable quality, manufacturing can operate at designed-for rates rather than constantly firefighting bottlenecks. The $17.5M in cost savings is important; the $11M in incremental manufacturing capacity (without new equipment) is transformational. For a growing manufacturer, this efficiency gain enables significant top-line growth without major capital expenditure.

Related Support

Built on Transparent Buyer Feedback

Verified review profile
Transparent Buyer Feedback

LIFA Global Trade welcomes verified customer reviews on Trustpilot. Real feedback from buyers helps you evaluate our China sourcing support, communication, and coordination services with confidence and transparency.

Your honest feedback helps us improve our sourcing support and helps other buyers make informed decisions.

Common Questions About Manufacturing Supply Chain Optimization

Find answers to questions buyers commonly ask about manufacturing supply chain optimization.

Proper planning around manufacturing supply chain optimization is critical to timeline success. LIFA helps coordinate these steps in sequence so delays don't cascade into production delays or missed shipment windows.

Common mistakes include underestimating complexity, not organizing communication clearly, and moving forward without proper verification. LIFA's coordination helps prevent these by keeping steps structured and reviewable.

Yes. Contact LIFA with your specific manufacturing supply chain optimization-related sourcing question. Email simon@lifasourcing.com or message WhatsApp +86 173 7653 5037 to discuss how LIFA can coordinate support.

Start with the Knowledge Center for comprehensive guides, then browse sourcing scenarios to see how other buyers have handled similar manufacturing supply chain optimization-related challenges. LIFA's team can provide personalized guidance for your situation.

Questions About This

Common questions to help you understand this service or topic better.

This service covers supplier coordination, verification support, and organized communication to help you make better sourcing decisions.

Timeline depends on your specific needs. Most projects take 2-4 weeks for initial phases. Contact Simon for a project estimate.

No. LIFA helps review supplier information and coordinate verification, which reduces risk. Buyers apply final judgment before payment.

Email simon@lifasourcing.com, message WhatsApp +86 173 7653 5037, or use the request quote form.

Industrial sourcing context

Visual references for the supplier communication, verification, quality review, and shipment preparation work behind this page.

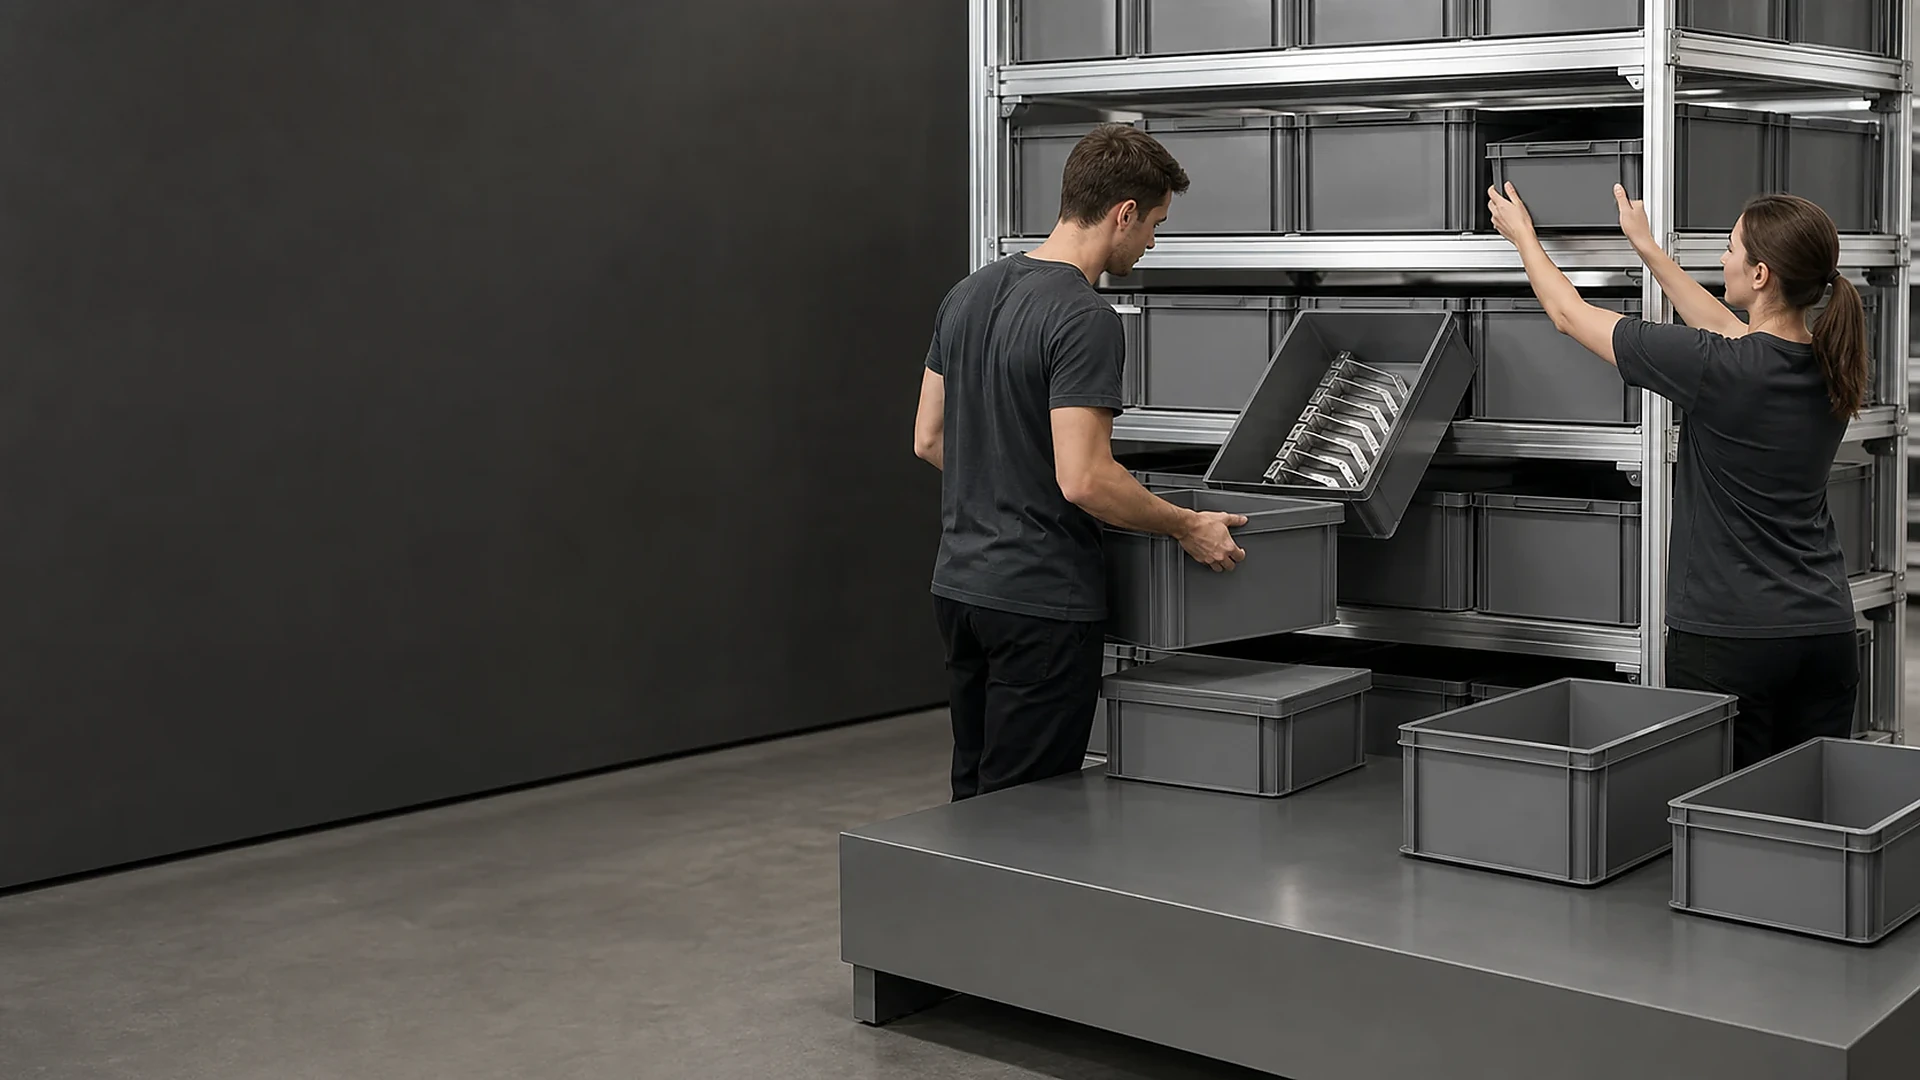
Industrial equipment sourcing and supplier capability review

Supplier-side review

Buyer requirements, supplier answers, and open questions should be organized before any purchase commitment.

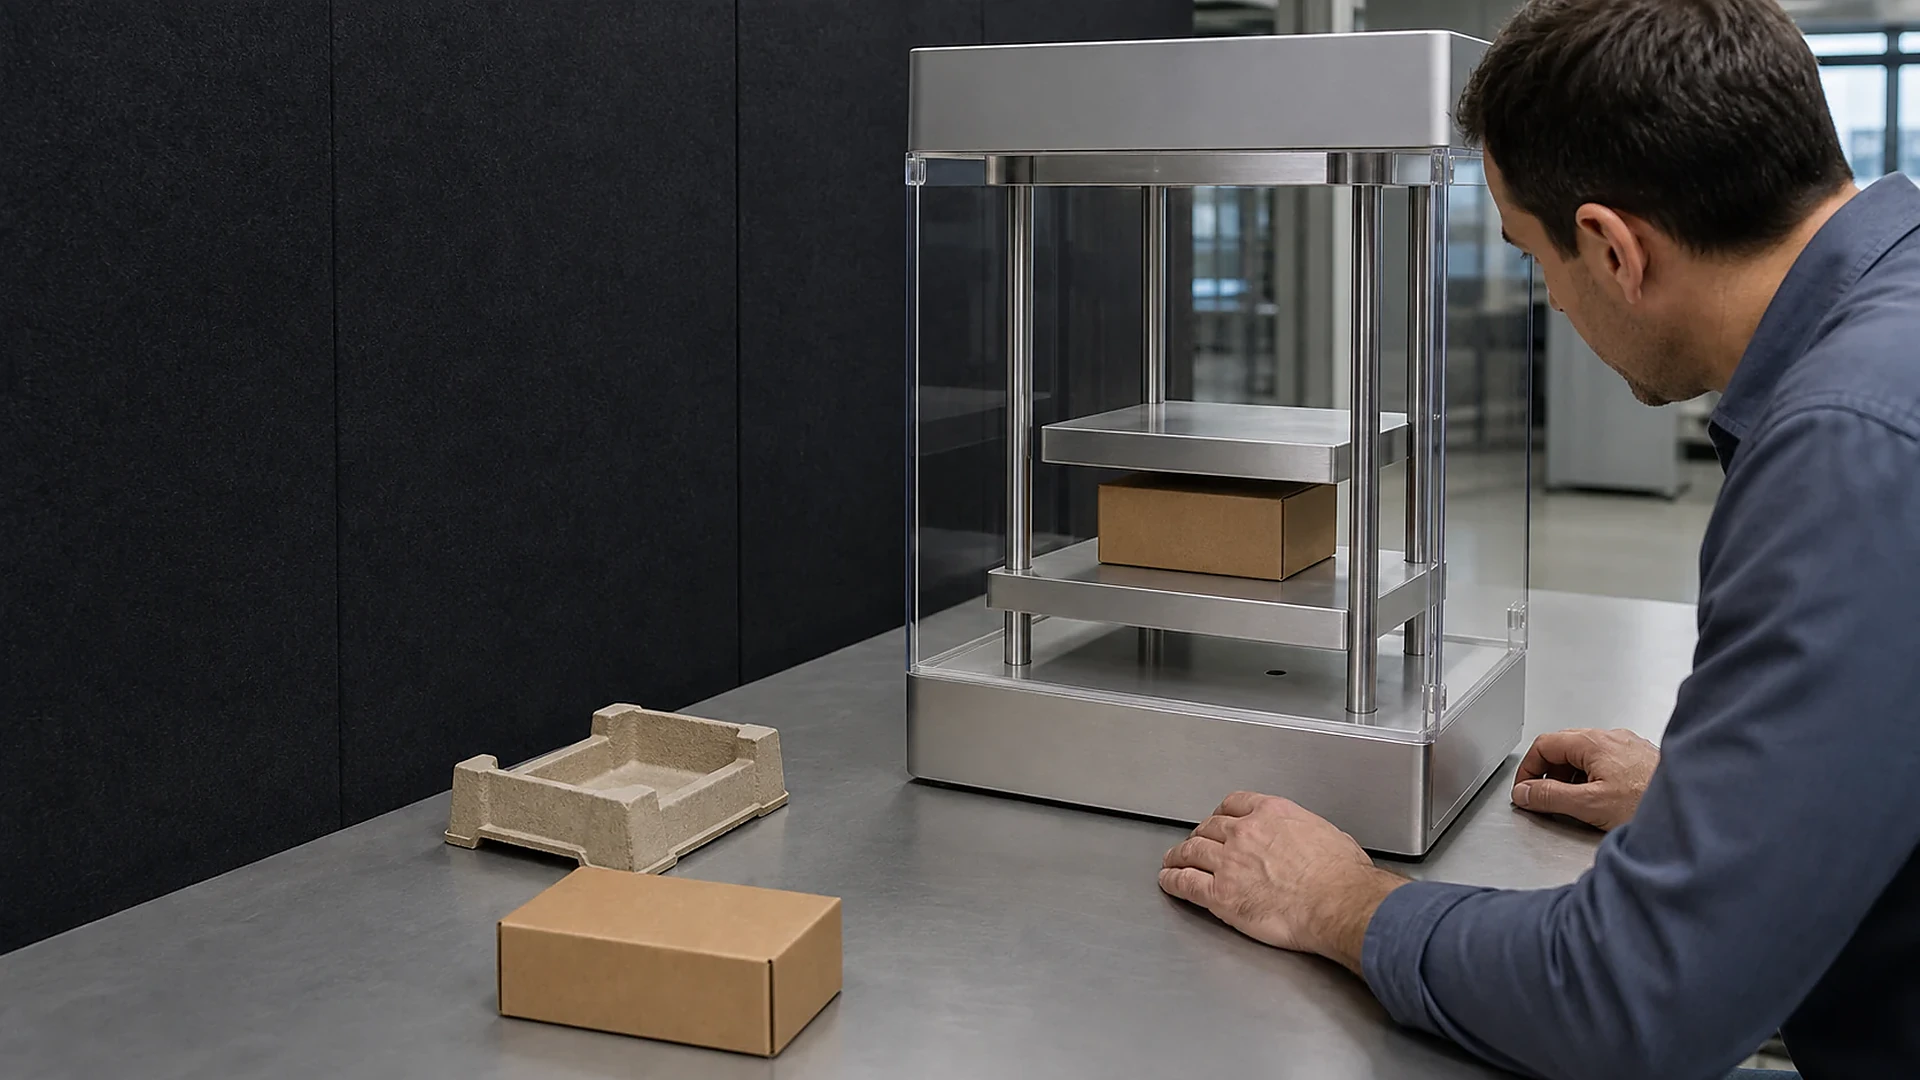
Industrial equipment sourcing and supplier capability review supporting sourcing checkpoint

Verification checkpoint

Documents, samples, inspection points, packaging details, and handover timing need clear confirmation.

Ready for hands-on support

Let LIFA coordinate the manufacturing supply chain optimization work for you.

Share your manufacturing supply chain optimization-related details and sourcing needs with LIFA. Get expert coordination from Hangzhou to streamline your supplier communication and China-side verification steps.